Home  5  Books  5  GBEzine  5  News  5  HelpDesk  5  Register  5  GreenBuilding.co.uk
Not signed in (Sign In)

Categories


Green Building Bible, Fourth Edition
Green Building Bible, fourth edition (both books)
These two books are the perfect starting place to help you get to grips with one of the most vitally important aspects of our society - our homes and living environment.

PLEASE NOTE: A download link for Volume 1 will be sent to you by email and Volume 2 will be sent to you by post as a book.

Buy individually or both books together. Delivery is free!


powered by Surfing Waves


Vanilla 1.0.3 is a product of Lussumo. More Information: Documentation, Community Support.

Welcome to new Forum Visitors
Join the forum now and benefit from discussions with thousands of other green building fans and discounts on Green Building Press publications: Apply now.


    • CommentAuthorcjard
    • CommentTimeFeb 11th 2017
     
    I've the general feeling that his house I've built is doing well from an energy consumption perspective, especially considering a reasonable chunk of it is double glazed and I still have a lot of fettling of systems to do but there's little science to this; it's just a report from my father in law(who built the neighbouring semi to a similar spec as I did) who is clock watching the electricity meter. My house uses 20 quid a week (16p/kWh) and his uses 35 (something wrong with that picture; his house is empty, heating off, 5 days a week)

    I'm sure he will also be interested in what I can learn from this thread

    So I'm after doing some data logging.. Just not sure what I'll need to measure, and what with (product recommendations). You can assume I've got loads of spare computing power and ability to program them, I just need connectable hardware. I'm also not so flush with money at the moment, until I temortgae the place so the boss will turn down any outlandish purchase requests :)

    Some weather station seems a given, temperature monitors for rooms, or maybe pipes. Electrical power consumption devices (clamp round cable type preferred, but I can also still cut the cable and joint it in as the cables leaving the CU are accessible..) might be required too?
    •  
      CommentAuthorSteamyTea
    • CommentTimeFeb 11th 2017
     
    I use the CurrentCost Envi to monitor electricity usage connected to a Raspberry Pi.
    I think CurrentCost have gone for good, but there is a bit of kit for sale on eBay. You need to get the USB cable though.

    For temperature and humidity there are the DHT22's they seem pretty reliable, you can use 1Wire DS18B20's, easier to wire in if you want multiple ones (just wire them all back to GPIO4).

    Cheap weather stations are a waste of money, I bought one from Maplin in a sale (50 quid), the anemometer packed up in a few weeks and then the thing failed to send data to the RPi.

    If you have Gas heating it is a bit harder to log, though there are some people doing it with magnets and light sensors (not having gas I don't take much notice.

    I am currently making up a heat meter for a solar thermal system to see if that can be logged. Got the bits, just not got the time.
    • CommentAuthorEd Davies
    • CommentTimeFeb 11th 2017
     
    I too have a CurrentCost meter feeding a Raspberry Pi. Bit of my own Python taking their little bursts of XML, extracting the power use and temperature, and throwing them into a MQTT broker (mosquitto). Also some 1-wire temperature sensors (DS18B20's?) sitting on some breadboard on my desk similarly fed via OWFS to some Python to MQTT. Separate Python script subscribed to MQTT and logging as JSON to text files.

    {"_": "2017-02-11T09:37:47Z", "cc": {"power": 184, "temperature": 19.6}}
    {"_": "2017-02-11T09:37:48Z", "kitchen": {"humidity": 37, "temperature": 17.29}}
    {"_": "2017-02-11T09:37:53Z", "cc": {"power": 184, "temperature": 19.6}}
    {"_": "2017-02-11T09:37:58Z", "ow": {"28.B21AC8010000": 21.9375, "28.D517C8010000": 21.8125, "28.E3F2C7010000": 21.9375}}
    {"_": "2017-02-11T09:37:59Z", "cc": {"power": 184, "temperature": 19.5}}
    {"_": "2017-02-11T09:38:05Z", "cc": {"power": 184, "temperature": 19.5}}

    For general use it's hard to beat the vAir temperature/humidity sensors:

    http://shop.vair-monitor.com/index.php?rt=product/product&product_id=134

    I have one (originally got a COâ‚‚ monitor with temperature, humidity and pressure sensors then I ordered two of these but he made a mistake and only sent one - the other should be here in a day or so). They need micro-USB power but send via WiFi so very convenient for scattering around the house without wires trailing all over the place. All a bit of a work in progress but he's actively developing and pretty responsive to any problems.

    What I'd really like would be to have an outdoor temperature sensor (other than a liquid-in-glass thermometer exposed to the sun in the porch which came with the house) and some way of tracking when the boiler's running to see how the correlate.

    I've been logging stuff for about three months now. The most useful bit of information I've got is on power use. For my off-grid house I'd been worrying about whether 6 kW of inverters would be a limitation - e.g., don't use the kettle while the cooker's one - but actually the only times I've gone over 6 kW have been when using the 7 kW shower. Nice to know and very easy to find out once the data's logged.
    •  
      CommentAuthorSteamyTea
    • CommentTimeFeb 11th 2017
     
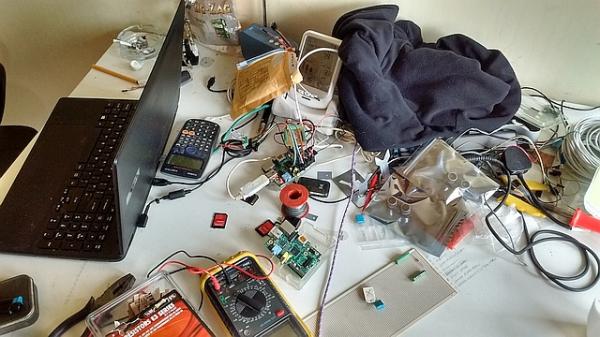
    Here is an image of what I am doing at the moment.
    Don't they say that a messy bench is a sign of a creative mind.
      Raspberry Pi.jpg
    •  
      CommentAuthorSteamyTea
    • CommentTimeFeb 11th 2017 edited
     
    My logged data is a bit different to Ed's.
    I save more than what is strictly needed (from when I was setting up several of these).
    The data comes out like this, but could easily be changed to show just temperature and power.
    I have two separate transmitters, a normal clamp on sort and an Opti one (nice to know the difference and this is going to a friends house to log her PV output and general consumption). 0=Opti,2=clamp on.
    The ST logger is a bit trickier as I have to know when the pump is on, but think I have got around that with a simple relay and just log the time when it is closed i.e. pump running (that bit of code has been this mornings work).

    Here is what my basic data looks like (you may have to pop it into Excel to make better sense of it).
    Date and Time,Text String Lengh,Days since birth,Temp /°C,Sensor No, Sensor ID,Power1,Power2,Power3
    09/02/2017 17:45:08,166,00982,15:26:12,24.4,0,03420,00065,,
    09/02/2017 17:45:12,166,00982,15:26:15,24.4,2,03584,00081,,
    09/02/2017 17:45:46,166,00982,15:26:59,24.4,2,03584,00081,,
    09/02/2017 17:45:48,166,00982,15:27:01,24.3,0,03420,00065,,
    09/02/2017 17:46:03,166,00982,15:27:07,24.3,0,03420,00065,,
    09/02/2017 17:46:07,166,00982,15:27:11,24.4,2,03584,00079,,
    09/02/2017 17:46:09,166,00982,15:27:12,24.4,0,03420,00065,,
    09/02/2017 17:46:14,166,00982,15:27:17,24.4,2,03584,00079,,
    09/02/2017 17:46:14,166,00982,15:27:18,24.4,0,03420,00065,,
    09/02/2017 17:46:20,166,00982,15:27:23,24.4,2,03584,00079,,
    09/02/2017 17:46:25,166,00982,15:27:29,24.4,0,03420,00066,,
    09/02/2017 17:46:26,166,00982,15:27:30,24.4,2,03584,00081,,
    09/02/2017 17:46:30,166,00982,15:27:34,24.4,0,03420,00066,,
    09/02/2017 17:46:32,166,00982,15:27:36,24.4,2,03584,00059,,
    09/02/2017 17:46:36,166,00982,15:27:40,24.4,0,03420,00066,,
    •  
      CommentAuthorSteamyTea
    • CommentTimeFeb 11th 2017 edited
     
    And here is my Python script for the CC (Ed don't like my coding :bigsmile:). It looses all the indents when pasted as just text, how do you do that HTML formatting code thingy?

    #!/usr/bin/python

    import serial, time, datetime


    while True:

    #Open the USB Serila port
    cc128 = serial.Serial("/dev/ttyUSB0", 57600, timeout=6)

    #Read the USB Serial port
    text = cc128.readline()[:]

    #Splits up the data
    length = len(text)
    if len(text)==166:
    dsb = text[32:37]
    time = text[49:57]
    temperature = text[70:74]
    sensor = text[89:90]
    sensorID = text[103:108]
    ch1 = text[139:144]
    ch2 = text[170:175]
    ch3 = text[201:206]


    #Sort out the time format
    timestamp = datetime.datetime.now().strftime ('%d/%m/%Y %H:%M:%S')


    #Opens and writes to the text file where the data is stored
    tfile = open("/home/homemonitoring/homemonitoringdata/ccdata.csv", "a")
    tfile.write("%s"%timestamp + ",%s"%length + ",%s"%dsb + ",%s"%time + ",%s"%temperature + ",%s"%sensor + ",%s"%sensorID + ",%s"%ch1 + ",%s"%ch2 + ",%s"%ch3 + "\n")
    tfile.close()

    # time.sleep(6)
    •  
      CommentAuthordjh
    • CommentTimeFeb 11th 2017 edited
     
    For weather data, try going to wunderground and getting a local forecast. At the bottom of the page is a list of nearby weather stations. I was lucky enough to find a semi-pro nearby with 15 years of data on his site so I have never got around to rebuilding the weather logging I had at my old house. edit: I just had another look and now there's a nearly next door neighbour with a site too.

    I presume you and your father in law are using electrical heating? Thinking about kWh rather than £ is more useful. You need to record internal and external temperatures as well as electrical consumption. Also some estimate of insolation - I use our PV generation as a proxy. A piece of paper and a pencil is adequate technology in my view.

    If his house is unheated for five days a week then 218 kWh in two days implies a continuous draw of over 9 kW. Is he standing under the shower all weekend? Or growing pot? What temperature is it in his house?

    edit: OOPS that 9 kW should be 4.5 kW, so not so bad but still quite a lot.
    •  
      CommentAuthorSteamyTea
    • CommentTimeFeb 11th 2017 edited
     
    Let's see if I can get the code up and formatted correctly (with Ed's help, seems to work a treat, thanks again)


    #!/usr/bin/python

    import serial, time, datetime

    while True:

    #Open the USB Serial port
    cc128 = serial.Serial("/dev/ttyUSB0", 57600, timeout=6)

    #Read the USB Serial port
    text = cc128.readline()[:]

    #Splits up the data
    length = len(text)
    if len(text)==166:
    dsb = text[32:37]
    time = text[49:57]
    temperature = text[70:74]
    sensor = text[89:90]
    sensorID = text[103:108]
    ch1 = text[139:144]
    ch2 = text[170:175]
    ch3 = text[201:206]

    #Sort out the time format
    timestamp = datetime.datetime.now().strftime ('%d/%m/%Y %H:%M:%S')

    #Opens and writes to the text file where the data is stored
    tfile = open("/home/homemonitoring/homemonitoringdata/ccdata.csv", "a")
    tfile.write("%s"%timestamp + ",%s"%length + ",%s"%dsb + ",%s"%time + ",%s"%temperature + ",%s"%sensor + ",%s"%sensorID + ",%s"%ch1 + ",%s"%ch2 + ",%s"%ch3 + "\n")
    tfile.close()

    # time.sleep(6)
    • CommentAuthorcjard
    • CommentTimeFeb 11th 2017
     
    Personally I think his ASHP is nuts. He turned it off last week as opposed to setting all the stats on 5 degrees, and it used 8quid (he keeps the kWh readings , I only hear the £ ones). I reckon his MVHR runs too fast, as its audible. Mine doesn't run at all at the mo, but the UFH circulator pumps run continuously (not linked to ASHP control).. So, yeah. Something definitely awry, as I use my house daily, and there are 3 of us vs his one

    Ill have to make some time and go have a play with his system, as right now he's considering all sorts of crazy ideas. Like.. "In summer I think I'll turn the ASHP off entirely and just use the immersion for hot water"
    •  
      CommentAuthorSteamyTea
    • CommentTimeFeb 12th 2017
     
    Is his house using any energy when he is away?
    • CommentAuthorDarylP
    • CommentTimeFeb 12th 2017
     
    We used two self-powered USB temp monitors, one inside and one outside (sheltered out of direct sunshine) for a year, collecting temps every 30mins IIRC, downloaded data straight into two CSV/XL files.
    Match these data with fuel bills, and should be easy enough?
    :smile:
    • CommentAuthorcjard
    • CommentTimeFeb 13th 2017
     
    ST, boatloads of it.. He is experimenting with what is acually using the power.. As an example, he says he left his heating and MVHR on, went away and used 30 quid in the week. Turning heating and MVHR off it apparently used 8 quid in the week instead..

    I'm not sure what the deal is there, as bar an Internet router and two fridges, I can't think of anything else that would use power when he is out.. Time to throw in some science I think
    •  
      CommentAuthorSteamyTea
    • CommentTimeFeb 14th 2017 edited
     
    Does the MVHR have an electric post heater?
    What temperature is his DHW?

    A broken fridge can be pulling 100 to 200W constantly (I know as mine went faulty), that would be between £2.5 and £5 a week.
    • CommentAuthorborpin
    • CommentTimeFeb 21st 2017
     
    Posted By: Ed DaviesWhat I'd really like would be to have an outdoor temperature sensor
    Why not just pull the data off WeatherUnderground?
    • CommentAuthorborpin
    • CommentTimeFeb 21st 2017
     
    Posted By: cjardI just need connectable hardware.
    Have a look at OpenEnergyMonitor.org Don't be put off by the headline cost, you can do it cheaper by just buying the bits and not the ready to go Pi based system.
    • CommentAuthorcjard
    • CommentTimeFeb 22nd 2017
     
    It doesn't look like they charge a huge premium for the kit TBH.. Cheers for the find!
Add your comments

    Username Password
  • Format comments as
 
   
The Ecobuilding Buzz
Site Map    |   Home    |   View Cart    |   Pressroom   |   Business   |   Links   
Logout    

© Green Building Press