Home  5  Books  5  GBEzine  5  News  5  HelpDesk  5  Register  5  GreenBuilding.co.uk
Not signed in (Sign In)

Categories


Green Building Bible, Fourth Edition
Green Building Bible, fourth edition (both books)
These two books are the perfect starting place to help you get to grips with one of the most vitally important aspects of our society - our homes and living environment.

PLEASE NOTE: A download link for Volume 1 will be sent to you by email and Volume 2 will be sent to you by post as a book.

Buy individually or both books together. Delivery is free!


powered by Surfing Waves


Vanilla 1.0.3 is a product of Lussumo. More Information: Documentation, Community Support.
Welcome to new Forum Visitors
Join the forum now and benefit from discussions with thousands of other green building fans and discounts on Green Building Press publications: Apply now.


    •  
      CommentAuthordjh
    • CommentTimeFeb 3rd 2020
     
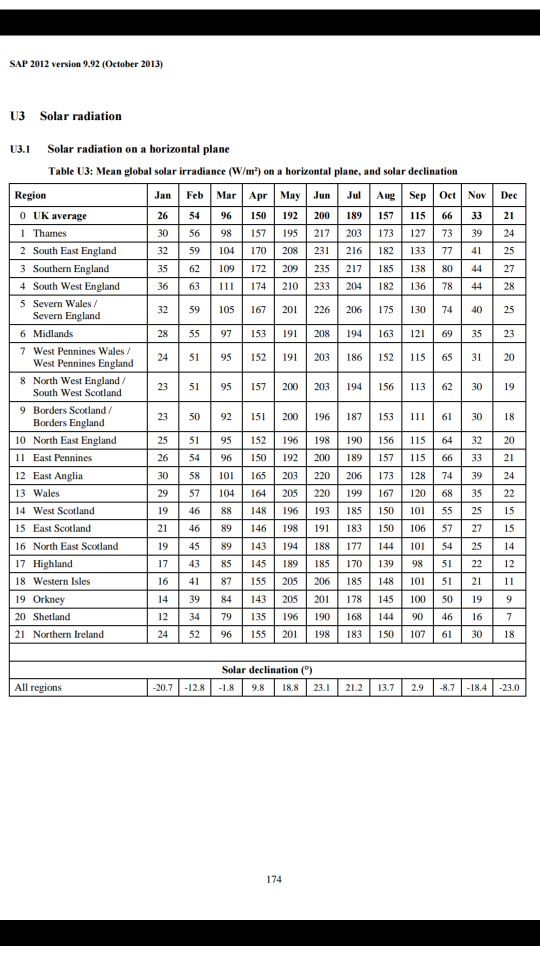
    Does anybody know of a source of solar irradiance data?

    Specifically broken into fairly small areas?

    I'm trying to forecast how much heat my house needs each day. Apart from the internal and external temperatures, I think the other major factor is solar gain. So I'd like to get hold of records of irradiance over the past year or more and also a 24-hour forecast of irradiance (or longer :)

    Historical data I can estimate from my solar generation records but it would be good to have an external source to compare against, and a forecast is the most important bit.
    • CommentAuthordaserra
    • CommentTimeFeb 3rd 2020
     
    The book "Solar Electricity" by Simon Roberts has some usable solar insolation maps in the appendixs'.
    •  
      CommentAuthorfostertom
    • CommentTimeFeb 3rd 2020
     
  1.  
    Came across some in SAP appendix U while looking at something else today... There's also formulae to convert to inclined surfaces
    https://www.bregroup.com/sap/sap10/
      Screenshot_20200203-192128-540x960.png
    •  
      CommentAuthordjh
    • CommentTimeFeb 3rd 2020
     
    Thanks for the ideas, chaps, but I'm looking for much more fine-grained data than that.

    The question I want to answer is:
    How much solar irradiation is there going to be tomorrow where I live?

    And the much easier question:
    How much solar radiation was there each day last year where I live?

    As I say, I can estimate an answer to the second question from my solar generation records, but how to answer the first question? And ideally compare it with historical data from the same source.
  2.  
    AIUI it used to be quite expensive to measure solar irradiation so many climate stations measure 'sunshine hours' series instead. There's some empirical conversion methods.

    This may mean that the only person who is measuring solar irradiation at your location, is you ...

    But you might be able to get sunshine hours records from your nearest met station (airports are good) and sunshine hours forecasts for that location from a forecast agency (might have to pay).
    • CommentAuthorphiledge
    • CommentTimeFeb 4th 2020
     
    With our Solaredge PV inverter connected via wifi to the Solaredge web portal, generation was logged every 15 mins but I stopped using it a while ago so cant verify that for you.

    I cant remeber if the portal allows you to download data but if theres somone in your area using a Solaredge inverter you may be able to get local data from them or possibly from Solaredge themselves. I would guess if the generation data is delinked from personal data then theres no issue with them releasing it??
    • CommentAuthorphiledge
    • CommentTimeFeb 4th 2020
     
    Forgot to say that the forecast generation figures given to us before PV install are a little away from reality as we generate noticeably more. Not sure if that inaccuracy applies to all industry data but the figures our installers used were wrong for our locality
    •  
      CommentAuthorDamonHD
    • CommentTimeFeb 4th 2020
     
    Given that PV output (and thus irradiance) can vary significantly from year to year, eg 3229kWh up to 3981kWh over the last few years for us, and PVgis predictions came in at 3780kWh is was pretty representative, and PVgis uses fairly local features for its prediction, I'm not understanding your issue with it...

    Rgds

    Damon
    • CommentAuthorbhommels
    • CommentTimeFeb 4th 2020
     
    The Metoffice keeps all kinds of data, from historical data from weather stations that have run for a long time as well as more recent data on -amongst others- sunshine hours:
    https://www.metoffice.gov.uk/research/climate/maps-and-data/uk-temperature-rainfall-and-sunshine-time-series

    I think that the variation in solar PV production compared to PVGIS really depends on where you are in the country. My data is surprisingly consistent: annual averages vary only a few %, the biggest excursions over the last 8 years all fall within 10% of the total. Monthly averages correlate really well with the Metoffice data/maps:
    https://www.metoffice.gov.uk/research/climate/maps-and-data/uk-actual-and-anomaly-maps
    •  
      CommentAuthorfostertom
    • CommentTimeFeb 4th 2020
     
    I love the way windy SW England has highest irradiation (Cornish palm trees and early flowers) - and top of Dartmoor highest of all, by a long way (either sheeting rain or sparkling bright)!
  3.  
    Posted By: philedgeWith our Solaredge PV inverter connected via wifi to the Solaredge web portal, generation was logged every 15 mins but I stopped using it a while ago so cant verify that for you.

    I cant remeber if the portal allows you to download data


    It does.

    Despite myself I'm in the habit of checking mine daily and there's a csv download option that changes granularity depending if you are looking on a Day/Week/Month/Year basis.
    •  
      CommentAuthordjh
    • CommentTimeFeb 4th 2020
     
    Thanks for all the additional comments. Yes, I can get historical data from my Enphase PV system, as I said.

    What I'm looking for is forecast data. Just one day would be enough. Knowing today how much energy I should have bought yesterday is no real help.

    AFAIK, PVGIS only offers historical data, not forecasts. Ditto for the Met Office, except for web and TV forecasts not designed for data extraction and not explicit for solar radiation. Met Office DataHub does offer local machine readable forecasts but only a vague UV index, not even a cloud cover percentage, let alone an irradiance forecast.
    •  
      CommentAuthorDamonHD
    • CommentTimeFeb 5th 2020
     
    OK, now I understand that you want a specific forecast not a generic prediction.

    I do something very very crude to bias use of my off-grid storage (I allow it to discharge it a little further if tomorrow looks like it will get recharged)...

    The line from my RPi crontab is:

    57 4,11,21 * * * if [ "sunny" != "`wget --retr-symlinks -q -O - https://weather-broker-cdn.api.bbci.co.uk/en/forecast/rss/3day/kt1 | awk '/<title>.*emperature/ { if(++count==2) {if($0 ~ /[Ss]unny/){printf("sunny");}exit;} } '`" ] ; then rm -f /var/run/FORECAST_PV_GEN_GOOD.flag; else touch /var/run/FORECAST_PV_GEN_GOOD.flag; fi

    Basically I regard the forecast tomorrow as 'good' if I can find the word 'sunny' in the the appropriate line of the BBC forecast.

    Rgds

    Damon
    •  
      CommentAuthordjh
    • CommentTimeFeb 5th 2020
     
    Thanks, Damon. That's pretty much what I was coming round to, except that I planned to scrape the Met Office forecast because I wasn't aware of the BBC RSS feeds. But having a working example to start from helps a lot :bigsmile:

    A couple of points that I just noticed:
    (1) For me anyway, I get a more precise forecast by using the name of my nearby town rather than a larger postcode prefix area. Maybe that's because I live in a relatively rural area.
    (2) What's with the --retr-symlinks option? It doesn't seem to be necessary.

    How reliable is the word 'sunny', in your experience? Do they never use alternative expressions?
    I suspect the other thing I could look at is the UV index. But only as a cut-off. If the UV index is greater than one then I expect I don't need any heating. But I'll have to capture some data and observe reality.

    I've just got a couple of T+RH sensors and a couple of T+RH+Pressure+VOC sensors. I plan to put them in the ducts to/from my MVHR to give me a fairly complete log of conditions. There's a dust sensor to integrate after that.

    I asked the Met Office whether they had any solar irradiation forecasts and they said yes, but I would have to pay for them. :cry:
    •  
      CommentAuthorDamonHD
    • CommentTimeFeb 5th 2020
     
    The BBC feed seems pretty formulaic, indeed may be autogenerated, and when I've been paying attention this seems to work reasonably well, to drive a SMALL change in my maximum depth of discharge.

    There hasn't been a lot of opportunity over the last couple of months to see if it's doing what I expect, but it seems OK. The forecast fell back from 'tomorrow looks good' to 'not' in the last few hours and the new value lines up with the forecast page that I normally look at.

    Yes, the needing to pay thing is not hugely astonishing, because orgs such as National Grid and others (farmers, outdoor events organisers, etc) probably are prepared to...

    Rgds

    Damon

    PS. I think that for a while when the BBC was changing forecast providers the URLs were bouncing around. Anyhow, if it works for now I'm not touching it!
    • CommentAuthorgoodevans
    • CommentTimeFeb 6th 2020 edited
     
    djh, I woke up this morning and noticed that the heat loss from the house was slightly more than I expected overnight based on the temperature outside. I suspect it may have been down to the fact that my roof comprises of 35% of the envelope area and was significantly colder than the ambient temperature due to the clear sky. In effect the opposite effect of the daytime solar radiance (although not so dramatic). If you are going to go for the solar gain prediction you may also find it useful to add in a clear night loss prediction (and for that matter maybe a correction for wind chill factor).

    Scraping the metoffice website for data may be possible - each of the weather icons (hourly in the near future) has a name "Sunny day", "Clear night", "Partly cloudy (night)", "Cloudy", "Clear night" etc. My guess is that just these icons together with the temperature and wind speed would give you a very good idea of the predictive gain and loss from your property.

    The downside is that the forecasts are not available retrospectively so that you can to fit the forecast data to your house data, also forecasts change - you will have to decide how far into the 'future' you should base your prediction on and of course forecasts will be different to actual - so a further correction may be required.
    •  
      CommentAuthordjh
    • CommentTimeFeb 6th 2020
     
    Thanks, Paul. Very useful post. Yes, I agree that clear night sky will have an effect, but I suspect that with my roof being somewhat shiny aluminium, the effect will be down in the noise at least at this stage. Ditto for wind chill. At the moment I'm just trying to account for factors that are big enough that I have noticed them having an effect with my animal brain.

    Yes, my plan now is to scrape the met office website*. I spent yesterday evening setting up cron jobs to capture forecasts from DataHub and the website, because I realized as you say that forecasts are transient. I'm currently taking snapshots every three hours, and will do that until I work out exactly what data I do need. I've been collecting observations from the nearest weather stations for quite a while now and should start to have my own temperature and humidity data soon.

    I plan to parse the website snapshots and extract the icons and store their raw details. Then I can experiment with possible weightings to get a number - my initial thought is +1 for a Sunny Intervals and +2 for a Sunny Day from the hourly forecasts of the next day's weather, but I'll have to see how well those factors work out in practice.

    And then at some point I'll use it to control the heating, but I suspect that will have to be next winter now, since we're coming towards the end of the heating season.

    * I might have another go at the Met Office to publish the data. It seems to me that both Damon and myself want the data to experiment to reduce our energy usage to help save energy and the planet. The data, or rather proxies for it in the shape of the sunny icons, is already published in a human-readable form, so it seems reasonable to me that they should also publish it in machine readable format, which would also make experiments more repeatable and comparable.
    •  
      CommentAuthorDamonHD
    • CommentTimeFeb 7th 2020 edited
     
    \o/


    Note that we've already paid for it once through our taxes, so a lumpier version that has less commercial value should be made publicly available IMHO.

    An equivalent of the "delayed by 15 minutes" stock market prices that are widely available for free, even though the live stuff is very pricey...

    Rgds

    Damon
    • CommentAuthorjms452
    • CommentTimeFeb 11th 2020
     
    Is this is close to what you are after - although it goes regional at best:

    https://carbon-intensity.github.io/api-definitions/#get-generation-from-to
    • CommentAuthordereke
    • CommentTimeFeb 11th 2020
     
    @djh this might work for you https://darksky.net/dev/docs

    Pricing is good too, free for less than 1000 requests per day
    • CommentAuthorBeau
    • CommentTimeFeb 11th 2020 edited
     
    Posted By: djhThanks for the ideas, chaps, but I'm looking for much more fine-grained data than that.


    And the much easier question:
    How much solar radiation was there each day last year where I live?

    As I say, I can estimate an answer to the second question from my solar generation records, but how to answer the first question? And ideally compare it with historical data from the same source.


    Quite a lot of personal weather stations record solar Radiation if thats any help. Try Wundermap for a local station
    •  
      CommentAuthordjh
    • CommentTimeFeb 12th 2020
     
    Thanks chaps. It still looks to me like scraping the BBC web forecast for the word 'sunny' is the best way to get an estimate of tomorrow's solar irradiation.
    • CommentAuthorborpin
    • CommentTimeFeb 12th 2020 edited
     
    @djh did you see this post on OEM

    https://community.openenergymonitor.org/t/ev-charging-solar-demand-shaper-agile/13159/13

    Pulling forecast off Darksky.
    •  
      CommentAuthordjh
    • CommentTimeFeb 12th 2020
     
    Posted By: borpinPulling forecast off Darksky.

    I hadn't seen that post yet, so thanks. But darksky doesn't have an irradiation forecast, or even 'sunniness'. The closest it gets is cloudiness.
    • CommentAuthorborpin
    • CommentTimeFeb 18th 2020 edited
     
    Posted By: djhBut darksky doesn't have an irradiation forecast, or even 'sunniness'.
    There is the "UV index and cloud cover". There is a fair correlation it seems between the 2. How accurate do you want it?
    •  
      CommentAuthordjh
    • CommentTimeFeb 18th 2020
     
    UV index at the moment is 0 at night and 1 during daylight. That doesn't really help.
    I've no idea how to convert cloud cover to a sunniness number.
    What do you mean about a correlation?
Add your comments

    Username Password
  • Format comments as
 
   
The Ecobuilding Buzz
Site Map    |   Home    |   View Cart    |   Pressroom   |   Business   |   Links   
Logout    

© Green Building Press